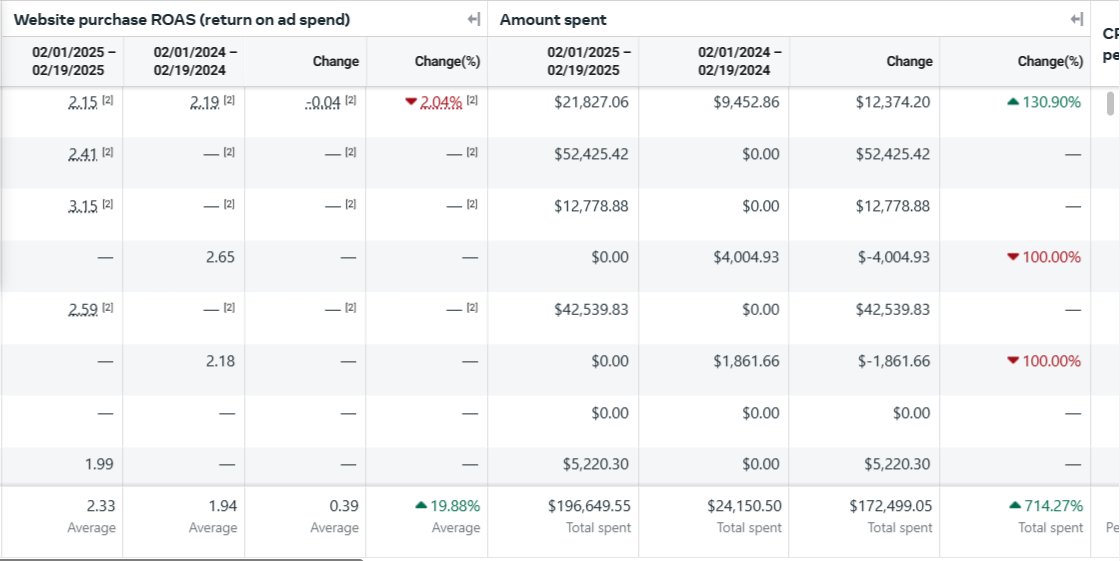
A jewelry brand selling worldwide was stuck near 1.2 purchase ROAS. Nine months later it was spending 8x more on Meta than the same weeks a year earlier, at 2.33 ROAS instead of 1.94.

A direct-to-consumer jewelry brand that sells online worldwide. The US is its biggest market, followed by Australia, the UK and Europe.
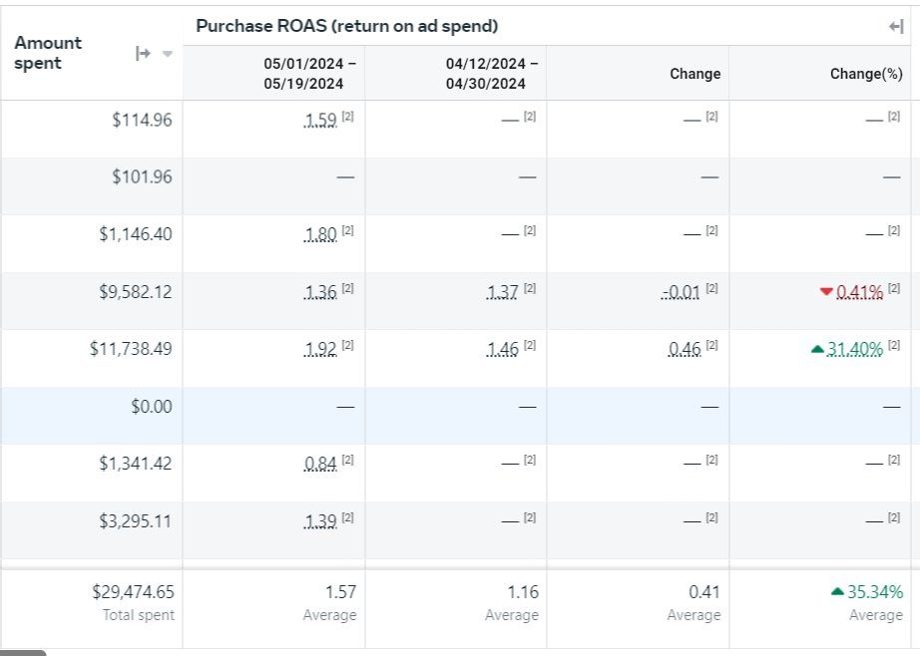
The brand was already spending well into five figures a month on Meta when I came in. The problem was efficiency. In the weeks before I started, purchase ROAS was 1.16, as reported by Meta. The owners broke even at 1.34, so every extra dollar on Meta was losing money.
Jewelry is a hard category on Meta. It is a gift or a considered buy, so people click and leave. Competition for the same audiences is heavy, especially before the holidays. And selling into many countries from one account splits the budget and the data.
| Industry | Jewelry, direct to consumer |
| Market | Sells worldwide, US is the main market |
| Price point | Mid-range, a typical gift purchase |
| Starting point | 1.16 purchase ROAS on Meta (Apr 12 to 30, 2024), break-even at 1.34 |
| Channels I ran | Meta ads, with Klaviyo flows and Google Ads alongside |
| Engagement | May 2024 to Feb 2025 |
Spend grew 8x year over year while ROAS went up, not down. All figures are reported by Meta, in USD.
| Window | ROAS before | ROAS after | Spend before | Spend after |
|---|---|---|---|---|
| Feb 1 to 19, 2024 vs same dates 2025 | 1.94 | 2.33 | $24,151 | $196,650 |
| Jan 2024 vs Jan 2025 | 1.79 | 1.84 | $72,937 | $242,993 |
| Apr to May 2024 vs Jun to Jul 2024 | 1.33 | 1.50 | $107,367 | $146,635 |
| Apr 12 to 30 vs May 1 to 19, 2024 (first 19 days) | 1.16 | 1.57 | $29,475 |
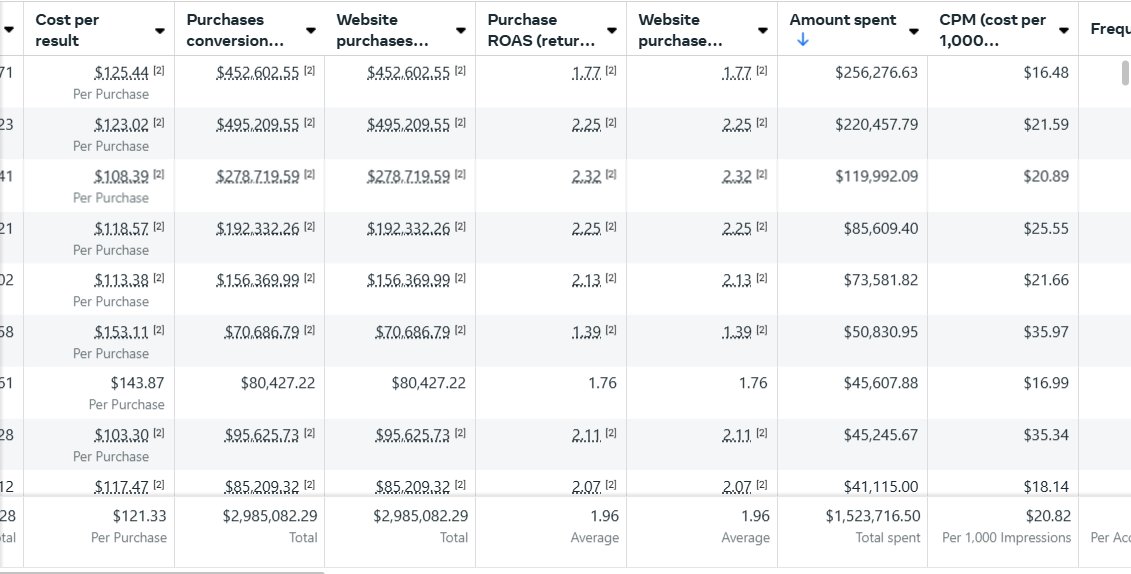
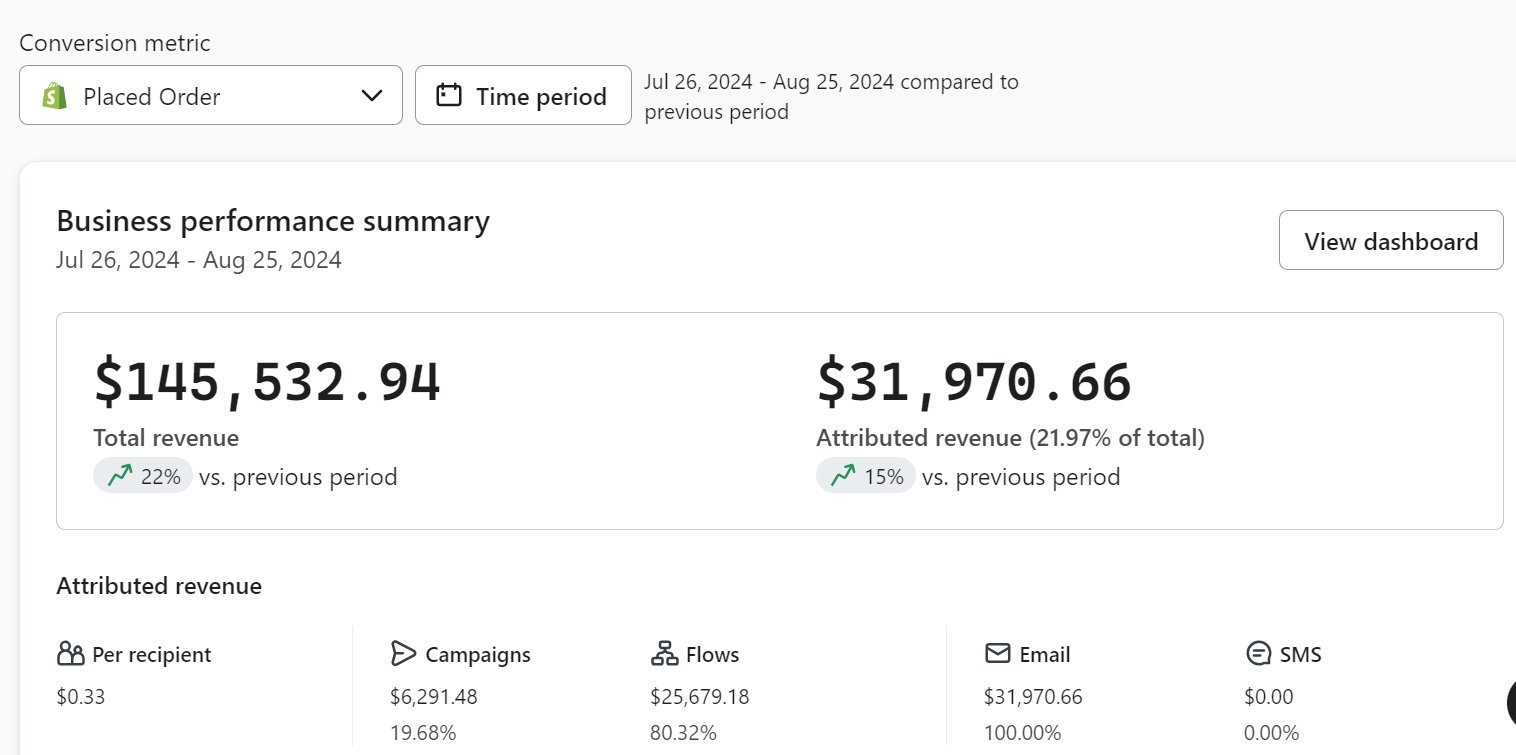
Full engagement, May 1, 2024 to Feb 19, 2025: $1,523,717 spend, $2,985,082 purchase value, 1.96 ROAS, $121.33 cost per purchase, about 12,560 purchases. Email, reported by Klaviyo: 21.97% of store revenue from Jul 26 to Aug 25, 2024, up from about 15% at the audit. Google Ads, reported by Google, May 2024 to Feb 2025: 3,865 conversions at 2.97 ROAS.
Straight from the ad accounts. Campaign and account names cropped out.


I look at your ads, email and tracking before we talk, so the call starts with real findings.
In month one you get a ranked list of what to fix first and what it should move.
No juniors and no account managers in between. Meta gets daily attention.
I write the hooks, briefs and static concepts. Your team or editor produces them.
“Tal is an expert in his field, with an analytical, data-driven approach and industry awareness that sets him apart. After years of poor results with various ad agencies, Tal has been a breath of fresh air. His experience running his own e-commerce brands gives him a unique appreciation for the macro aspects of online business, which is hard to find elsewhere (trust me, we have tried!).”

Profit first, platform ROAS second. I work with a small number of brands at a time, on US and Canada hours, and I do the work myself.
Straight answers, from this account and my own jewelry brand.
It depends on your margin. Work out your break-even ROAS first. This brand broke even at 1.34, so 1.96 across the engagement was profitable, even though it looks low next to the numbers people post online.
Usually ROAS falls as spend rises. Here spend went up 8x year over year and ROAS still rose, because new spend went into proven ads and split markets, not wider targeting.
For most brands with a real catalog, yes, for scaling. Keep a separate testing campaign feeding it new ads, or it runs out of creative.
No. Countries with weaker ROAS pull down the strong ones and hide in the average. Give your main market its own campaigns.
Ads that show who wears it and why, more than product shots alone. Mixing video and static in flexible ads worked best here.
Here ROAS moved from 1.16 to 1.57 in the first 19 days, as reported by Meta. The bigger gains came over months of creative testing.
Same operator behind all of it. Pick what fits where you are.
Meta, Google Shopping and Klaviyo for jewelry brands, from the operator behind Brillianteers.
Jewelry →44% more purchases at a 26% lower cost per purchase, on about the same spend.
Case study →Real accounts, real numbers, with the date window on every figure.
See all →Sixty minutes, one-on-one, free. I review your Meta account before the call and tell you what I would change.