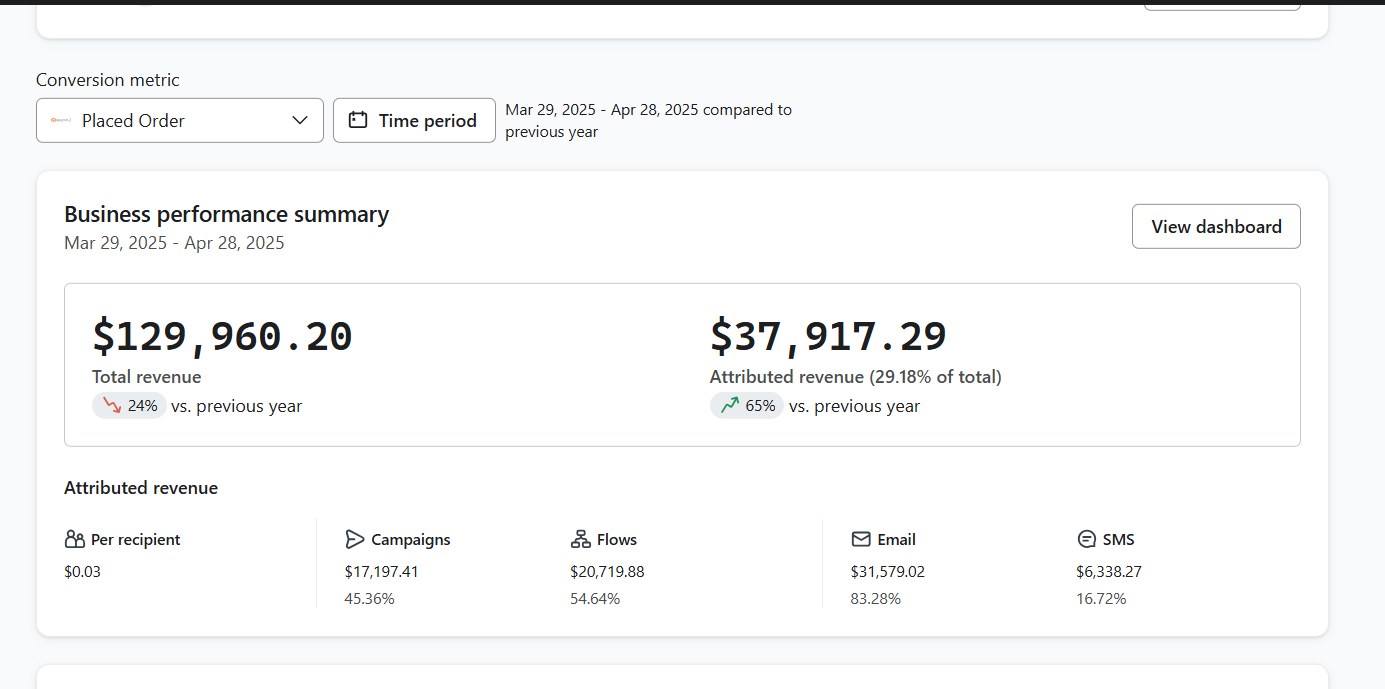
A US swimwear brand had email doing very little: a 2.5% popup opt-in, a 0.83% flow click rate, and every welcome sale on the first email. I rebuilt its five core flows. Six months later, in a month when store revenue was down 24% year over year, Klaviyo revenue was up 65%.

A direct-to-consumer swimwear brand in the US, selling online and through large retailers.
Swimwear is seasonal and discount-heavy. Most buyers come in once a year, compare a lot and wait for a code. That makes email the cheapest place to win them back, if the flows actually do their job.
Here they did not. The popup converted 2.5% of visitors, flow emails got a 0.83% click rate, and the welcome flow gave away 25% and then 35% off almost immediately.
| Industry | Swimwear, direct to consumer |
| Country | United States |
| Channel | Klaviyo email flows |
| Starting point | 2.5% popup opt-in, 0.83% flow click rate, Klaviyo about 13% of revenue |
| Scope | Welcome, browse, cart, checkout and post-purchase flows |
| Engagement | October 2024 to May 2025 |
The same 31 days a year apart, so seasonality cancels out. All figures reported by Klaviyo (Placed Order, Klaviyo attribution).
| Metric | Mar 29 to Apr 28, 2024 | Mar 29 to Apr 28, 2025 | Change |
|---|---|---|---|
| Total store revenue | ~$171,000 | $129,960 | -24% |
| Klaviyo-attributed revenue | ~$22,980 | $37,917 | +65% |
| Klaviyo share of revenue | ~13% | 29% | +16 pts |
| Revenue from flows | n/a | $20,720 | 16% of store revenue |
2024 figures are worked back from Klaviyo's reported change and are approximate. In the 2025 window, email was $31,579 and SMS $6,338 of the attributed total, and campaigns were $17,197. Klaviyo's report does not show order counts.
Straight from Klaviyo. No brand name in frame.

I look at your Klaviyo account before we talk: flows, popup, segments and what each email earns.
A map of every flow and email, with timing, offers and what each one should do.
Designed in Figma, built in Klaviyo so your team can still edit it.
Discounts, triggers and A/B tests adjusted on real numbers.

In at least five brands I have taken email from about 15% to the 30% range of revenue. I plan the flows, direct the design and build them in Klaviyo myself.
Straight answers, from this account.
A healthy store usually gets 20% to 30% of revenue from email and SMS. This brand went from about 13% to 29% in the same month a year apart.
Welcome, browse abandonment, cart abandonment, checkout abandonment and post-purchase. Get those five right before adding anything else.
Smaller than most brands think. Here it went from 25% to 10%, with bigger offers saved for later emails and last-chance moments.
Longer than the usual two or three emails. These flows run 8 to 10 emails each, with shared emails so shoppers who move between flows are not hit twice.
Yes, if it is built in Klaviyo's drag and drop blocks instead of one big image. That is how these were built.
Flows start earning as soon as they go live, but a fair read takes a full season. This comparison is about five months after launch, against the same dates a year earlier.
Same operator behind all of it. Pick what fits where you are.
Audits and flow rebuilds that have taken email from about 15% to the 30% range of revenue.
Klaviyo →Store revenue up 47% year over year, Google cost per purchase down 27%.
Case study →Real accounts, real numbers, with the date window on every figure.
See all →Sixty minutes, one-on-one, free. I review your flows before the call and tell you what each one is leaving on the table.