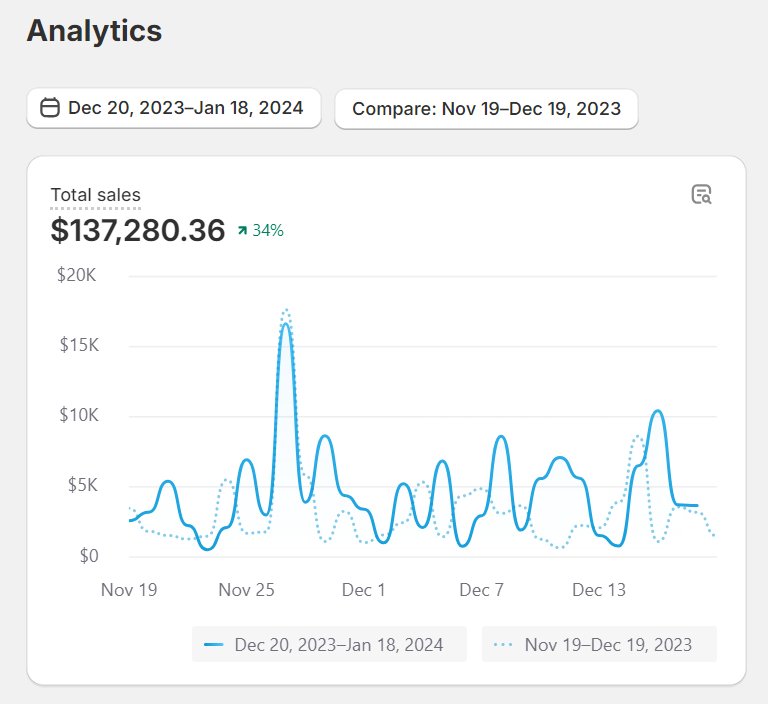
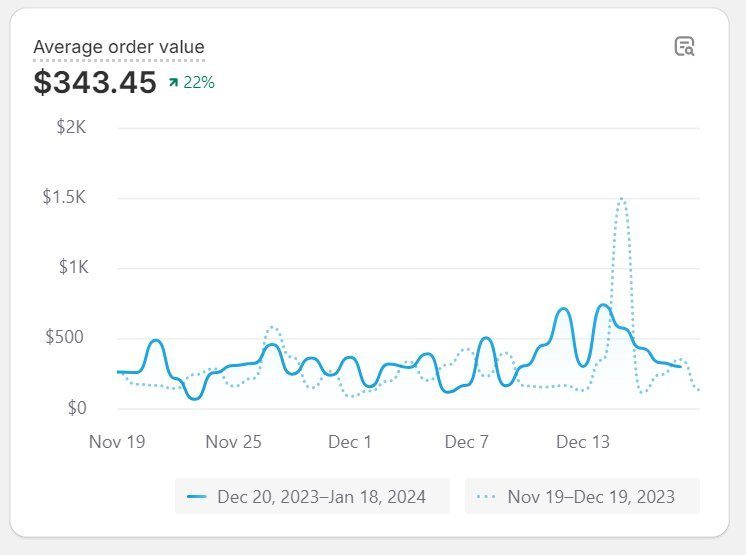
A US medical equipment retailer came in spending $14K a month on Google Ads at a 2.9x return. Two years in, monthly store revenue was up 47% year over year and Google's cost per purchase was down 27%.

A US medical equipment retailer selling new and certified pre-owned devices, plus the accessories and replacement parts that go with them.
Buyers usually arrive with a specific model in mind, so search intent is high and price comparison is brutal. About a fifth of orders closed offline, by phone or in store, so the ad accounts only saw part of what they drove.
When I started, Google Ads was spending about $14K a month at a 2.9x return, as reported by Google. On high-ticket devices with real cost of goods, that is close to break-even.
| Industry | Medical equipment ecommerce |
| Country | United States |
| Catalog | About 650 products, new and certified pre-owned |
| Starting point | $13,592 Google spend, 246 conversions, 2.9x ROAS (Oct 2023, reported by Google) |
| Channels I run | Google Ads, Microsoft Ads, Meta ads, Klaviyo email, site redesign |
| Engagement | November 2023 to today |
Nine months against the same nine months a year earlier. Store revenue and orders come from the store's Shopify orders (gross, before refunds). Google figures are reported by Google, primary purchase action only.
| Monthly average | Nov 2024 to Jul 2025 | Nov 2025 to Jul 2026 | Change |
|---|---|---|---|
| Store revenue | $166,034 | $243,654 | +47% |
| Store orders | 376 | 512 | +36% |
| Google ad spend | $17,124 | $26,592 | +55% |
| Google purchases | 259 | 552 | +113% |
| Google cost per purchase | $66 | $48 | -27% |
| Google ROAS | 6.2x | 8.9x | +44% |
Store sales stayed up year over year through September 2026 (+13%), though growth slowed after July. Starting point, Oct 2023: $13,592 Google spend, 246 conversions, 2.9x ROAS, as reported by Google.
From the first weeks of the engagement. Store analytics, no names in frame.


I look at your ads, email and tracking before we talk, so the call starts with real findings.
In month one you get a ranked list of what to fix first and what it should move.
No juniors and no account managers in between.
Spend sits next to orders and store sales, so you can sanity-check every number.

I work with a small number of ecommerce brands at a time on Google Ads, Meta and Klaviyo, on US and Canada hours, and I do the work myself.
Straight answers, from this account.
Performance Max per product category, plus Standard Shopping for best sellers. Performance Max finds new buyers, Shopping protects the products that already sell.
Most of it, yes. Some products fall under Google's healthcare policies and need certification or careful wording. The audit catches this before ads get disapproved.
Usually 4 to 8 weeks, once campaigns exit learning and have enough conversion data.
Usually duplicate or overlapping conversion actions, or values that include tax and shipping. Check Google against your store orders every month. On this page, store numbers lead and Google numbers are labeled.
No. Weekly search term reviews and monthly budget decisions. Daily changes usually hurt performance by resetting learning.
Feed first: titles that match real searches, complete attributes, custom labels for margin and sales rank. Then split campaigns so best sellers get a guaranteed budget.
Same operator behind all of it. Pick what fits where you are.
Store sales down 24% year over year, Klaviyo revenue up 65%.
Case study →8x the Meta spend year over year, with purchase ROAS up from 1.94 to 2.33.
Case study →Real accounts, real numbers, with the date window on every figure.
See all →Sixty minutes, one-on-one, free. I review your account and your store numbers before the call.